d o t o r e g . c o m
Prof. Dr. Mete ALPASLAN
Suspiciously Abnormal Treadmill Exercise Test with Normal Coronary Arteries

ECG 1a. The ECG aboe belongs to a 49-years-old man. It was recorded before the onset of exercise test.
Coronary angiography showed normal coornary arteries.
Click here for a more detailed ECG

ECG 1b. The ECG above belongs to the same man. It was recorded at the 5th minute 50th second of his exercise test.
Inferior leads (II, III and aVF) show down-sloping ST segment depression. ST depression is very clear, isn't it.
However, this clear ST depression is a result of the computer synthesis (by drawing an average ECG tracing from several cardiac cycles).
Indeed, it is indicated as "* Computer Synthesized Rhythms" on the right lower part of the paper.
Leads with preceding asterix (*) are actually computer synthesized tracings.
On the other han d, the lowermost V5 lead is raw data (true tracing).
Note the widespread baseline drift artifact in lead V5 with raw data.
If quality of raw data decreases, computer synthesized tracings derived from those data will be more erroneous.
Click here for a more detailed ECG
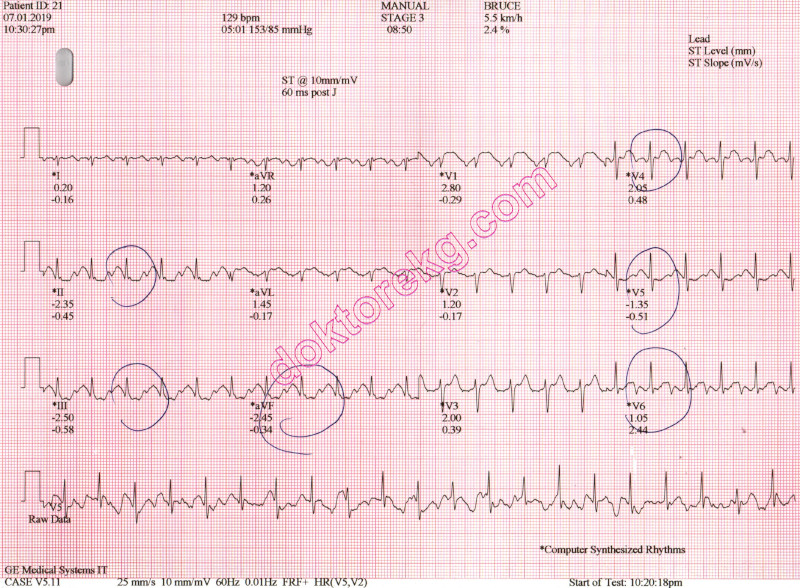
ECG 1c. The ECG above belongs to the same man. It was recorded at the 8th minute 50th second of his exercise test.
Baseline drift artifact in the raw data is less now. Inferior leads still show ST depression.
Click here for a more detailed ECG

ECG 1d. The ECG above belongs to the same man. It was recorded at the 12th minute 16th second of his exercise test.
Baseline drift artifact in the raw data is minor. Down-sloping ST depression in inferior leads is not seen any more.
This observation suggests that the ST segment depression in the previous ECG tracing was erroneous.
He has a very good exercise capacity, which is unlikely in a patient with significant coronary artery disease.
He did not complain of typical chest pain during this test.
Click here for a more detailed ECG

ECG 1e. The ECG above belongs to the same man. It was recorded at the first minute of his recovery period.
Downsloping type ST segment depression is not seen.
Upsloping type ST segment depression is not important in the diagnosis of coronary artery disease.
Persistence of ST segment deviations in the recovery period strongly suggests the presence of coronary artery disease.
In this patient, ST segment depression is not seen in the recovery period.
Click here for a more detailed ECG

ECG 1f. The ECG above belongs to the same man. It was recorded at the second minute of his recovery period.
ST segment deviation is not seen. Coronary angiography showed normal coronary arteries in this man.
Click here for a more detailed ECG

ECG 2a. The pre-test ECG above belongs to a 49 years-old man.
Click here for a more detailed ECG

ECG 2b. The ECG above belongs to the same man. It was recorded at the sixth minute of his exercise test.
Inferior leads (II, III and aVF) show up-sloping ST segment depression.
Up-sloping ST segment depression is NOT typical for myocardial ischemia.
The bottom V2 tracing shows the raw data (HAM VERI), which is clearly interpretable.
Reliability of the above computer-synthesized tracings depends on quality of the raw data.
Click here for a more detailed ECG

ECG 2c. The ECG above belongs to the same man. It was recorded at the ninth minute of his exercise test.
Click here for a more detailed ECG

ECG 2d. The ECG above belongs to the same man. It was recorded at the 11th minute 45th second of his exercise test.
This time, inferior leads (II, III, aVF) show horizontal ST segment depression.
However, the bottom V2 tracing (raw data - HAM VERI) is not as clear as it was in the previous ECGs.
This may result in erroneous construction of computer-synthesized tracings (in the other leads of this ECG).
The test was stopped at this stage.
Click here for a more detailed ECG

ECG 2e. The ECG above belongs to the same man. It was recorded at the first minute of the recovery period.
ST segment changes during the recovery period suggests strongly positive (abnormal) exercise test.
However, this patient did not develope horizontal or down-sloping ST segment depression during the recovery periord.
Click here for a more detailed ECG

ECG 2f. The ECG above belongs to the same man. It was recorded at the second minute of the recovery period.
ST segment changes during the recovery period suggests strongly positive (abnormal) exercise test.
However, this patient did not develope horizontal or down-sloping ST segment depression during the recovery periord.
After the test, this patient underwent coronary angiography which showed normal coronary arteries.
Click here for a more detailed ECG
ECG 1a. The ECG aboe belongs to a 49-years-old man. It was recorded before the onset of exercise test.
Coronary angiography showed normal coornary arteries.
Click here for a more detailed ECG
ECG 1b. The ECG above belongs to the same man. It was recorded at the 5th minute 50th second of his exercise test.
Inferior leads (II, III and aVF) show down-sloping ST segment depression. ST depression is very clear, isn't it.
However, this clear ST depression is a result of the computer synthesis (by drawing an average ECG tracing from several cardiac cycles).
Indeed, it is indicated as "* Computer Synthesized Rhythms" on the right lower part of the paper.
Leads with preceding asterix (*) are actually computer synthesized tracings.
On the other han d, the lowermost V5 lead is raw data (true tracing).
Note the widespread baseline drift artifact in lead V5 with raw data.
If quality of raw data decreases, computer synthesized tracings derived from those data will be more erroneous.
Click here for a more detailed ECG
ECG 1c. The ECG above belongs to the same man. It was recorded at the 8th minute 50th second of his exercise test.
Baseline drift artifact in the raw data is less now. Inferior leads still show ST depression.
Click here for a more detailed ECG
ECG 1d. The ECG above belongs to the same man. It was recorded at the 12th minute 16th second of his exercise test.
Baseline drift artifact in the raw data is minor. Down-sloping ST depression in inferior leads is not seen any more.
This observation suggests that the ST segment depression in the previous ECG tracing was erroneous.
He has a very good exercise capacity, which is unlikely in a patient with significant coronary artery disease.
He did not complain of typical chest pain during this test.
Click here for a more detailed ECG
ECG 1e. The ECG above belongs to the same man. It was recorded at the first minute of his recovery period.
Downsloping type ST segment depression is not seen.
Upsloping type ST segment depression is not important in the diagnosis of coronary artery disease.
Persistence of ST segment deviations in the recovery period strongly suggests the presence of coronary artery disease.
In this patient, ST segment depression is not seen in the recovery period.
Click here for a more detailed ECG
ECG 1f. The ECG above belongs to the same man. It was recorded at the second minute of his recovery period.
ST segment deviation is not seen. Coronary angiography showed normal coronary arteries in this man.
Click here for a more detailed ECG
ECG 2a. The pre-test ECG above belongs to a 49 years-old man.
Click here for a more detailed ECG
ECG 2b. The ECG above belongs to the same man. It was recorded at the sixth minute of his exercise test.
Inferior leads (II, III and aVF) show up-sloping ST segment depression.
Up-sloping ST segment depression is NOT typical for myocardial ischemia.
The bottom V2 tracing shows the raw data (HAM VERI), which is clearly interpretable.
Reliability of the above computer-synthesized tracings depends on quality of the raw data.
Click here for a more detailed ECG
ECG 2c. The ECG above belongs to the same man. It was recorded at the ninth minute of his exercise test.
Click here for a more detailed ECG
ECG 2d. The ECG above belongs to the same man. It was recorded at the 11th minute 45th second of his exercise test.
This time, inferior leads (II, III, aVF) show horizontal ST segment depression.
However, the bottom V2 tracing (raw data - HAM VERI) is not as clear as it was in the previous ECGs.
This may result in erroneous construction of computer-synthesized tracings (in the other leads of this ECG).
The test was stopped at this stage.
Click here for a more detailed ECG
ECG 2e. The ECG above belongs to the same man. It was recorded at the first minute of the recovery period.
ST segment changes during the recovery period suggests strongly positive (abnormal) exercise test.
However, this patient did not develope horizontal or down-sloping ST segment depression during the recovery periord.
Click here for a more detailed ECG
ECG 2f. The ECG above belongs to the same man. It was recorded at the second minute of the recovery period.
ST segment changes during the recovery period suggests strongly positive (abnormal) exercise test.
However, this patient did not develope horizontal or down-sloping ST segment depression during the recovery periord.
After the test, this patient underwent coronary angiography which showed normal coronary arteries.
Click here for a more detailed ECG