d o t o r e g . c o m
Dr. Mete ALPASLAN
Postextrasystolic T and U Wave Changes
Postextrasystolic T wave changes
 The first (may be the second and the third) sinus beat(s) following a ventricular premature beat may show negative, flattened or augmented T waves.
The cause is unknown.
In the past, it was suggested that these postextrasystolic T wave changes could be due to coronary artery disease or heart failure. Now, we know that this is not true.
Postextrasystolic U wave changes
The first (may be the second and the third) sinus beat(s) following a ventricular premature beat may show prominent U waves.
The cause is unknown.
In the presence of long QT interval, postextrasystolic augmentation of U wave suggests increased risk of arrhythmia.
Postextrasystolic U wave augmentation is a well-recognized adverse prognostic sign in patients with the "pause-dependent long QT syndrome". Patients with a prolonged QT interval showing bizarre TU complexes after PVCs are prone to the development of torsades de pointes and ventricular fibrillation.
In patients without the long QT syndrome, postextrasystolic U wave changes may be a specific marker of a tendency to the development of spontaneous ventricular arrhythmias.
T wave changes after cessation of tachycardia
After cessation of a narrow QRS tachycardia, the first few sinus beats may show negative T waves. This finding does not necessarily indicate the presence of coronary artery disease.
References
Pacing Clin Electrophysiol 2004;27(2):148-155.
Heart 2002;88(6):633.
Am J Cardiol 2000;85(2):261-263.
J Am Coll Cardiol 1996;28(7):1746-1752.
J Am Coll Cardiol 1995;25:1564-1575.
Prog Cardiovasc Dis 1988;31(2):115-172.
J Am Coll Cardiol 1983;2:806-817.
Am Heart J 1981;102(4):658-663.
Br Heart J 1977;39(4):371-374.

ECG 1. The ECG above belongs to a 59 years-old obese woman with hypertension and Diabetes Mellitus.
T wave of the first postextrasystolic beat is different than T waves of other sinus beats.
Click here for a more detailed ECG

ECG 2a. The ECG above belongs to a 64 years-old hypertensive man with normal ECHOcardiographic findings.
T wave of the first postextrasystolic beat is different than T waves of other sinus beats.
Click here for a more detailed ECG
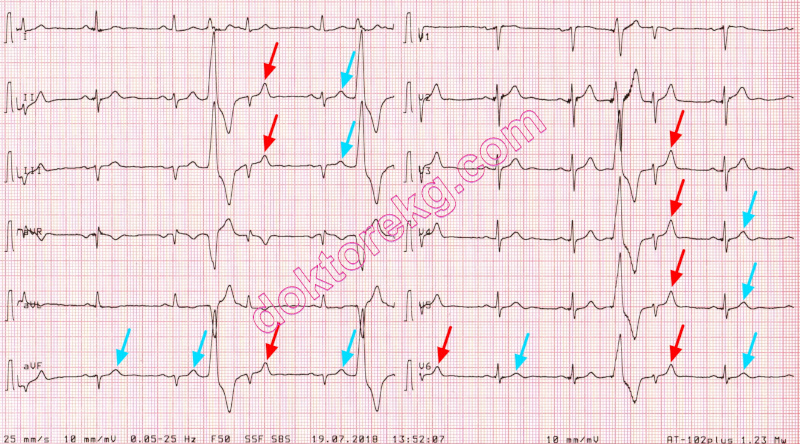
ECG 2b. The ECG above belongs to the same man. It was recorded 11 months after the ECG 2a.
T waves of the first postextrasystolic beats are different than T waves of other sinus beats.
Click here for a more detailed ECG

ECG 3. The 3-channel Holter tracing above shows that T wave of the first postextrasystolic beat,
is different than T waves of other sinus beats.
Click here for a more detailed ECG

ECG 4. The ECG above is from a 76 years-old man with previous coronary artery bypass grafting surgery.
T waves of the first postextrasystolic beats are different than T waves of other sinus beats.
Click here for a more detailed ECG

ECG 5. The ECG above is from a man with subacute inferior myocardial infarction.
U wave of the first postextrasystolic beat is taller than U waves of other sinus beats.
The second beat from the left is an atrial premature beat. Its P wave is different than other P waves in lead II.
Click here for a more detailed ECG
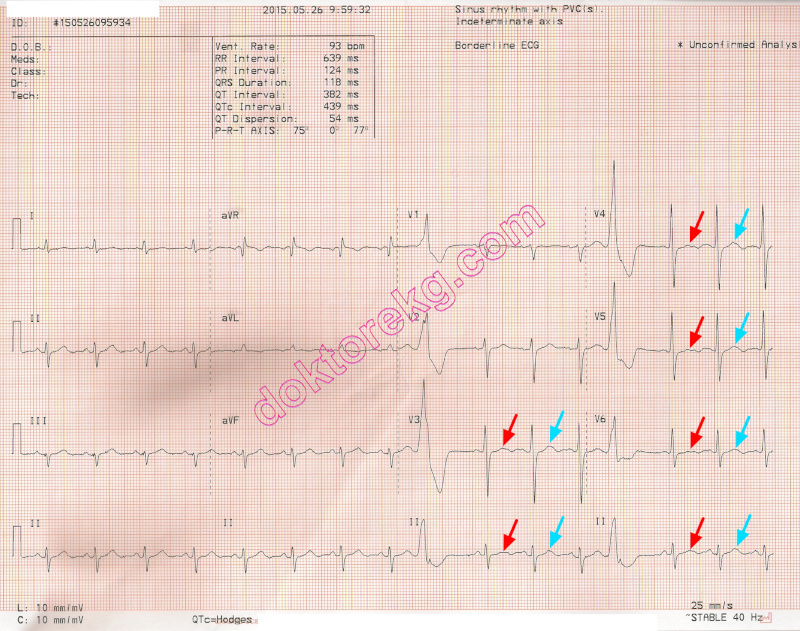
ECG 6a. The ECG above belongs to a 70 years-old man with normal ECHOcardiographic findings.
T waves of the first postextrasystolic beats are different than T waves of other sinus beats.
Click here for a more detailed ECG
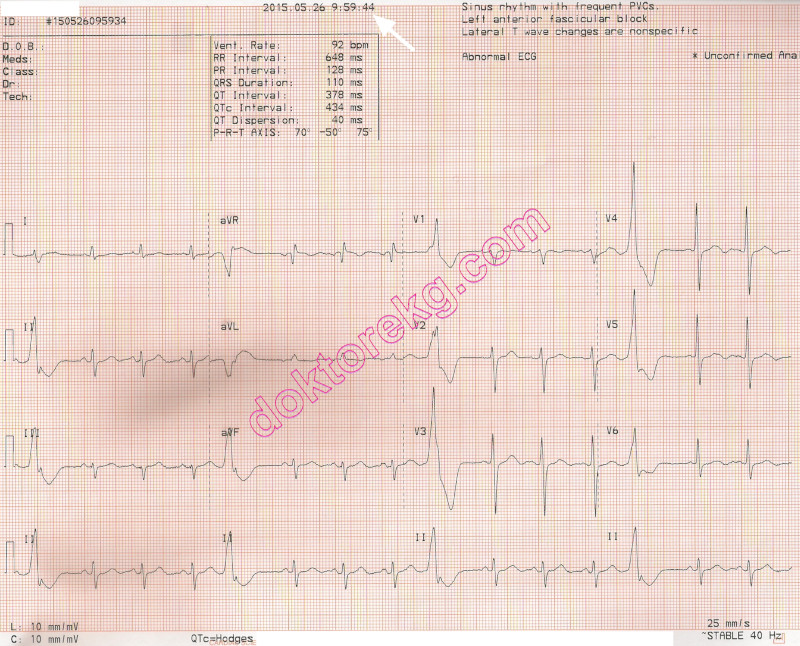
ECG 6b. The ECG above belongs to the same man. It was recorded immediately after the ECG 6a.
This time, T waves of the first postextrasystolic beats are NOT DIFFERENT than T waves of other sinus beats.
Click here for a more detailed ECG
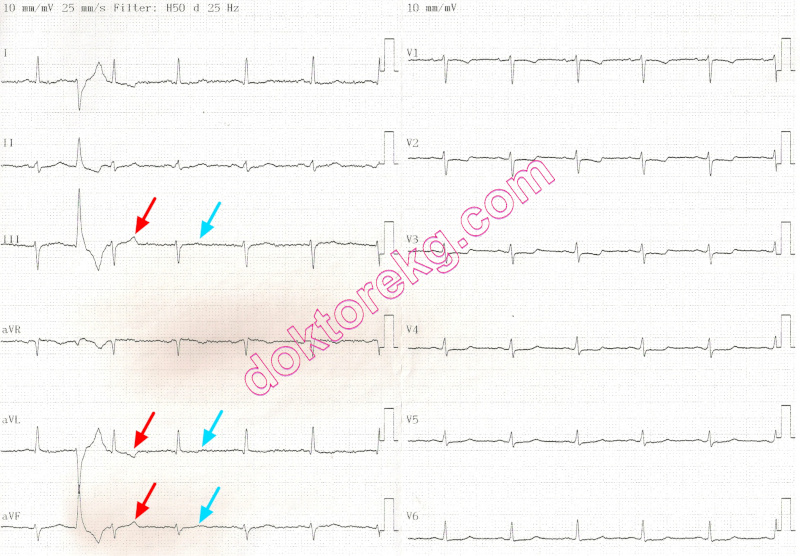
ECG 7. The ECG above belongs to a 64 years-old hypertensive woman with coronary artery disease.
T wave of the first postextrasystolic beat is different than T waves of other sinus beats.
Click here for a more detailed ECG

ECG 8. A similar phenomenon may be seen after narrow QRS tachycardias.
The 3-channel Holter tracing above belongs to a 21 years-old man.
The first 7 beats are the last beats of an ectopic atrial tahycardia.
The first two postextrasystolic T waves following the cessation of tachycardia are different than T waves of other sinus beats.
Click here for a more detailed ECG

ECG 9a. The 3-channel Holter tracing above belongs to a middle-aged woman with frequent attacks of non-sustained ventricular
tachycardia (VT). The recording is presented at a calibration of 10 mm/mV.
A pause of 1.4 seconds follows the cessation of VT attack.
Regarding the first post-pause sinus beat, T wave amplitude is decreased while U wave amplitude is increased.
The U wave amplitude of the pre-VT sinus beat is low.
Click here for a more detailed ECG
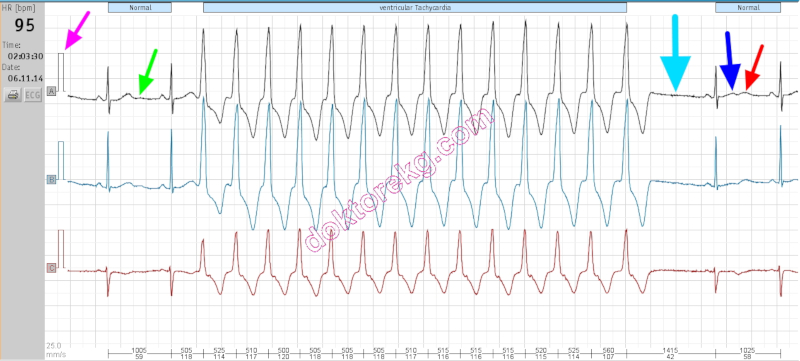
ECG 9b. The 3-channel Holter tracing above belongs to the same woman and depicts the same time frame.
This time, it is presented at a calibration of 15 mm/mV. The changes in T and U waves are more easy to perceive.
A pause of 1.4 seconds follows cessation of the VT attack. Amplitude of the first post-pause T wave is decreased.
Amplitude of the first post-pause U wave is increased when compared with amplitude of the pre-VT sinus beat's U wave.
Click here for a more detailed ECG
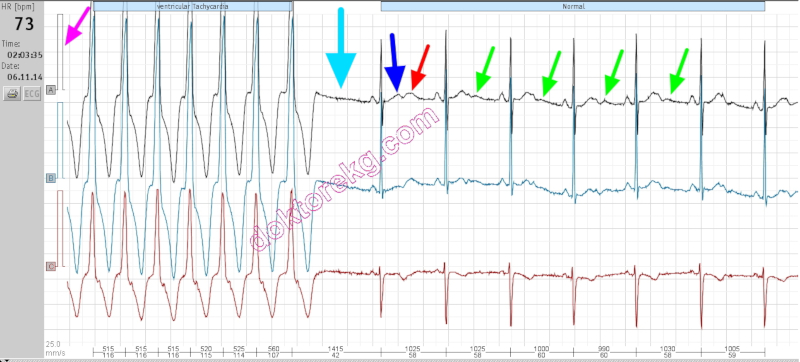
ECG 9c. The 3-channel Holter tracing above belongs to the same woman and shows 5 seconds later than the ECG 9b.
Now, it is depicted at a calibration of 30 mm/mV to show amplitude changes easily.
A pause of 1.4 seconds follows cessation of the VT attack.
When compared with T waves of other sinus beats, the first post-pause sinus beat has a low amplitude T wave.
When compared to U waves of other sinus beats, the first post-pause sinus beat shows an augmented U wave.
Click here for a more detailed ECG
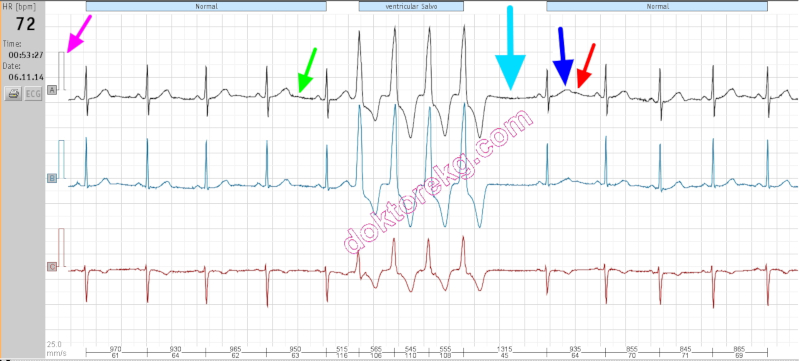
ECG 9d. The 3-channel Holter tracing above belongs to the same woman but shows a different time frame.
It is presented at a calibration of 15 mm/mV.
When compared with T waves of other sinus beats, the first post-pause sinus beat's T wave has a low amplitude.
When compared with U waves of other sinus beats, the first post-pause sinus beat's U wave is augmented.
Click here for a more detailed ECG

ECG 9e. The 3-channel Holter tracing above belongs to the same woman and depicts the same time frame as ECG 9d.
It is presented at a calibration of 30 mm/mV to make amplitude changes easily perceivable.
Now, U wave augmentation is clearly seen. When compared with T waves of other sinus beats,
the first post-pause sinus beat has a low amplitude T wave.
When compared to U waves of other sinus beats, the first post-pause sinus beat shows an augmented U wave.
Click here for a more detailed ECG
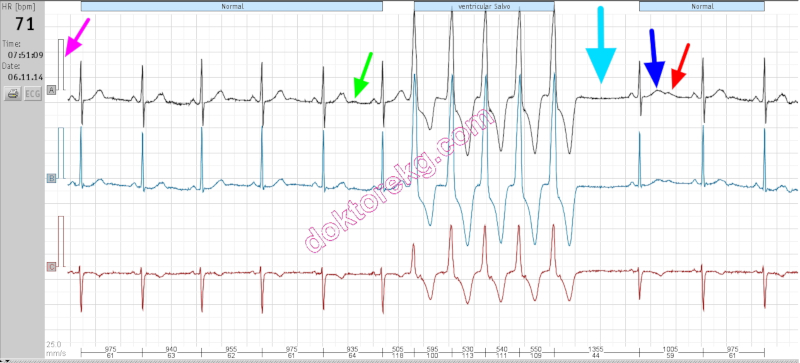
ECG 9f. The 3-channel Holter tracing above belongs to the same woman but shows a different time frame.
This time, the rhythm tracing is presented at a calibration of 20 mm/mV.
The first post-pause sinus beat has a low amplitude T wave.
When compared to U waves of other sinus beats, the first post-pause sinus beat shows an augmented U wave.
Click here for a more detailed ECG

ECG 10a. The ECG above is from a 52 years-old man who had experienced acute anterior myocardial infarction 7 months ago.
After the infarction, he had undergone coronary artery bypass surgery for 3 vessel disease.
Now, he has left ventricular anterior and inferior wall aneurysms with a very depressed left ventricle (EF 25%).
The ECG above shows ventricular trigeminy.
The P wave of the postextrasystolic beat seems to have normal duration.
The P wave of the second postextrasystolic beat seems to be widened: interatrial block?
Click here for a more detailed ECG
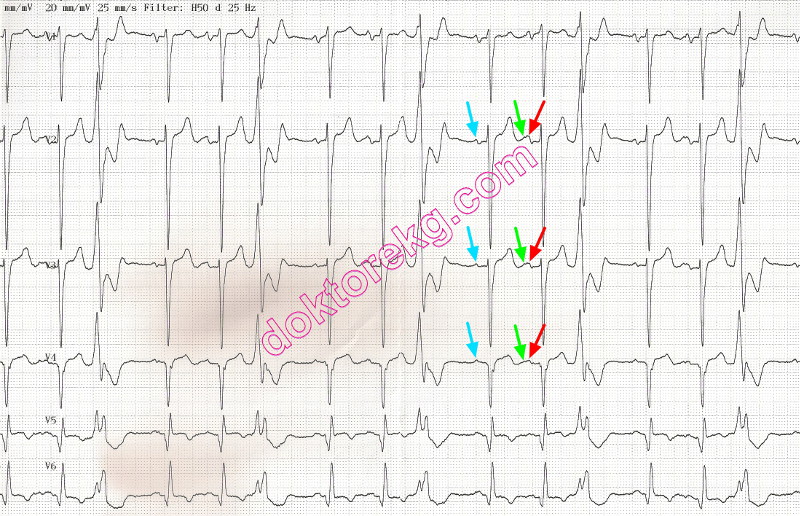
ECG 10b. Above is his immediately repeated ECG. This time, it was recorded at a calibration of 20 mm/mV.
This ECG clearly shows that the augmented U wave of the postextrasystolic beat fuses with the P wave of the second
postextrasystolic beat. This fusion results in a wide P wave and gives the impression of intermittent interatrial block, at first
glance. The P wave of the first postextrasystolic beat has a normal width since it has not been deformed by an augmented U wave.
Click here for a more detailed ECG
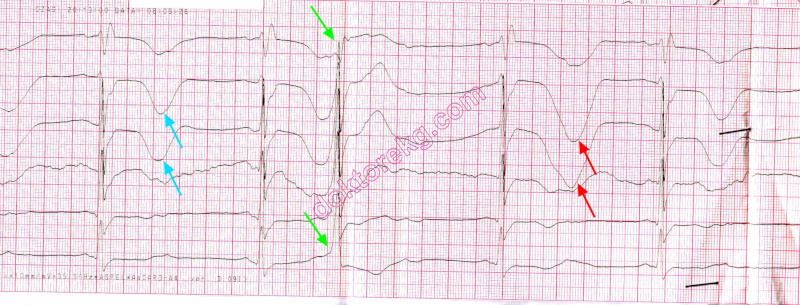
ECG 10. In the above ECG, the first postextrasystolic T wave is augmented.
T wave before the VPC is normal.
Click here for a more detailed ECG
Dr. Peter Kukla has donated the above ECG to our website.

ECG 11. In the above ECG, the first postextrasystolic U wave is augmented.
U waves from other sinus beats are normal.
Click here for a more detailed ECG
Dr. Peter Kukla has donated the above ECG to our website.

ECG 12. In the above ECG, the first postextrasystolic U wave is augmented.
U waves from other sinus beats are normal.
Fusion of T and U waves in the first postextrasystolic sinıs beat seems like prolonged QT interval.
Click here for a more detailed ECG
Dr. Peter Kukla has donated the above ECG to our website.
Postextrasystolic T wave changes
The first (may be the second and the third) sinus beat(s) following a ventricular premature beat may show negative, flattened or augmented T waves.
The cause is unknown.
In the past, it was suggested that these postextrasystolic T wave changes could be due to coronary artery disease or heart failure. Now, we know that this is not true.
Postextrasystolic U wave changes
The first (may be the second and the third) sinus beat(s) following a ventricular premature beat may show prominent U waves.
The cause is unknown.
In the presence of long QT interval, postextrasystolic augmentation of U wave suggests increased risk of arrhythmia.
Postextrasystolic U wave augmentation is a well-recognized adverse prognostic sign in patients with the "pause-dependent long QT syndrome". Patients with a prolonged QT interval showing bizarre TU complexes after PVCs are prone to the development of torsades de pointes and ventricular fibrillation.
In patients without the long QT syndrome, postextrasystolic U wave changes may be a specific marker of a tendency to the development of spontaneous ventricular arrhythmias.
T wave changes after cessation of tachycardia
After cessation of a narrow QRS tachycardia, the first few sinus beats may show negative T waves. This finding does not necessarily indicate the presence of coronary artery disease.
References
Pacing Clin Electrophysiol 2004;27(2):148-155.
Heart 2002;88(6):633.
Am J Cardiol 2000;85(2):261-263.
J Am Coll Cardiol 1996;28(7):1746-1752.
J Am Coll Cardiol 1995;25:1564-1575.
Prog Cardiovasc Dis 1988;31(2):115-172.
J Am Coll Cardiol 1983;2:806-817.
Am Heart J 1981;102(4):658-663.
Br Heart J 1977;39(4):371-374.
ECG 1. The ECG above belongs to a 59 years-old obese woman with hypertension and Diabetes Mellitus.
T wave of the first postextrasystolic beat is different than T waves of other sinus beats.
Click here for a more detailed ECG
ECG 2a. The ECG above belongs to a 64 years-old hypertensive man with normal ECHOcardiographic findings.
T wave of the first postextrasystolic beat is different than T waves of other sinus beats.
Click here for a more detailed ECG
ECG 2b. The ECG above belongs to the same man. It was recorded 11 months after the ECG 2a.
T waves of the first postextrasystolic beats are different than T waves of other sinus beats.
Click here for a more detailed ECG
ECG 3. The 3-channel Holter tracing above shows that T wave of the first postextrasystolic beat,
is different than T waves of other sinus beats.
Click here for a more detailed ECG
ECG 4. The ECG above is from a 76 years-old man with previous coronary artery bypass grafting surgery.
T waves of the first postextrasystolic beats are different than T waves of other sinus beats.
Click here for a more detailed ECG
ECG 5. The ECG above is from a man with subacute inferior myocardial infarction.
U wave of the first postextrasystolic beat is taller than U waves of other sinus beats.
The second beat from the left is an atrial premature beat. Its P wave is different than other P waves in lead II.
Click here for a more detailed ECG
ECG 6a. The ECG above belongs to a 70 years-old man with normal ECHOcardiographic findings.
T waves of the first postextrasystolic beats are different than T waves of other sinus beats.
Click here for a more detailed ECG
ECG 6b. The ECG above belongs to the same man. It was recorded immediately after the ECG 6a.
This time, T waves of the first postextrasystolic beats are NOT DIFFERENT than T waves of other sinus beats.
Click here for a more detailed ECG
ECG 7. The ECG above belongs to a 64 years-old hypertensive woman with coronary artery disease.
T wave of the first postextrasystolic beat is different than T waves of other sinus beats.
Click here for a more detailed ECG
ECG 8. A similar phenomenon may be seen after narrow QRS tachycardias.
The 3-channel Holter tracing above belongs to a 21 years-old man.
The first 7 beats are the last beats of an ectopic atrial tahycardia.
The first two postextrasystolic T waves following the cessation of tachycardia are different than T waves of other sinus beats.
Click here for a more detailed ECG
ECG 9a. The 3-channel Holter tracing above belongs to a middle-aged woman with frequent attacks of non-sustained ventricular
tachycardia (VT). The recording is presented at a calibration of 10 mm/mV.
A pause of 1.4 seconds follows the cessation of VT attack.
Regarding the first post-pause sinus beat, T wave amplitude is decreased while U wave amplitude is increased.
The U wave amplitude of the pre-VT sinus beat is low.
Click here for a more detailed ECG
ECG 9b. The 3-channel Holter tracing above belongs to the same woman and depicts the same time frame.
This time, it is presented at a calibration of 15 mm/mV. The changes in T and U waves are more easy to perceive.
A pause of 1.4 seconds follows cessation of the VT attack. Amplitude of the first post-pause T wave is decreased.
Amplitude of the first post-pause U wave is increased when compared with amplitude of the pre-VT sinus beat's U wave.
Click here for a more detailed ECG
ECG 9c. The 3-channel Holter tracing above belongs to the same woman and shows 5 seconds later than the ECG 9b.
Now, it is depicted at a calibration of 30 mm/mV to show amplitude changes easily.
A pause of 1.4 seconds follows cessation of the VT attack.
When compared with T waves of other sinus beats, the first post-pause sinus beat has a low amplitude T wave.
When compared to U waves of other sinus beats, the first post-pause sinus beat shows an augmented U wave.
Click here for a more detailed ECG
ECG 9d. The 3-channel Holter tracing above belongs to the same woman but shows a different time frame.
It is presented at a calibration of 15 mm/mV.
When compared with T waves of other sinus beats, the first post-pause sinus beat's T wave has a low amplitude.
When compared with U waves of other sinus beats, the first post-pause sinus beat's U wave is augmented.
Click here for a more detailed ECG
ECG 9e. The 3-channel Holter tracing above belongs to the same woman and depicts the same time frame as ECG 9d.
It is presented at a calibration of 30 mm/mV to make amplitude changes easily perceivable.
Now, U wave augmentation is clearly seen. When compared with T waves of other sinus beats,
the first post-pause sinus beat has a low amplitude T wave.
When compared to U waves of other sinus beats, the first post-pause sinus beat shows an augmented U wave.
Click here for a more detailed ECG
ECG 9f. The 3-channel Holter tracing above belongs to the same woman but shows a different time frame.
This time, the rhythm tracing is presented at a calibration of 20 mm/mV.
The first post-pause sinus beat has a low amplitude T wave.
When compared to U waves of other sinus beats, the first post-pause sinus beat shows an augmented U wave.
Click here for a more detailed ECG
ECG 10a. The ECG above is from a 52 years-old man who had experienced acute anterior myocardial infarction 7 months ago.
After the infarction, he had undergone coronary artery bypass surgery for 3 vessel disease.
Now, he has left ventricular anterior and inferior wall aneurysms with a very depressed left ventricle (EF 25%).
The ECG above shows ventricular trigeminy.
The P wave of the postextrasystolic beat seems to have normal duration.
The P wave of the second postextrasystolic beat seems to be widened: interatrial block?
Click here for a more detailed ECG
ECG 10b. Above is his immediately repeated ECG. This time, it was recorded at a calibration of 20 mm/mV.
This ECG clearly shows that the augmented U wave of the postextrasystolic beat fuses with the P wave of the second
postextrasystolic beat. This fusion results in a wide P wave and gives the impression of intermittent interatrial block, at first
glance. The P wave of the first postextrasystolic beat has a normal width since it has not been deformed by an augmented U wave.
Click here for a more detailed ECG
ECG 10. In the above ECG, the first postextrasystolic T wave is augmented.
T wave before the VPC is normal.
Click here for a more detailed ECG
Dr. Peter Kukla has donated the above ECG to our website.
ECG 11. In the above ECG, the first postextrasystolic U wave is augmented.
U waves from other sinus beats are normal.
Click here for a more detailed ECG
Dr. Peter Kukla has donated the above ECG to our website.
ECG 12. In the above ECG, the first postextrasystolic U wave is augmented.
U waves from other sinus beats are normal.
Fusion of T and U waves in the first postextrasystolic sinıs beat seems like prolonged QT interval.
Click here for a more detailed ECG
Dr. Peter Kukla has donated the above ECG to our website.