doktorekg.com
Atrial Flutter
Diagnostic criteria
 This is a regular atrial arrhythmia with an atrial rate of 250-350/minute.
Usually, there is no isoelectric baseline between atrial deflections (P waves). The high rate of atrial deflections result in "sawtooth" appearance.
Flutter waves are best seen in leads II, III and aVF.
All flutter waves cannot be conducted to ventricles. Usually there is a 2:1, 3:1 or 4:1 AV block. Sometimes, level of block may change spontaneously.
Even though the block may vary, atrial flutter is still accepted as a regularly irregular arrhythmia since level of block is not completely irregular.
When needed, Lewis lead modification may be used to see flutter waves more clearly.
Clinical significance
Holter recordings may show alternating episodes of atrial flutter and atrial fibrillation in the same patient.
The ventricular rate is expected to be low in patients receiving high dose digoxin, amiodarone or beta blocker therapy.
The pharmacological control of ventricular rate is more difficult in atrial flutter than atrial fibrillation.
Atrial flutter usually occurs in subjects with organic heart diseases. On the other hand, atrial fibrillation may be seen in patients without organic heart diseases.
Atrial flutter is less common than atrial fibrillation in adults but more common in children.
In patients with preexisting bundle branch block, development of supraventricular tachycardia may resemble ventricular tachycardia at first glance. Similarly, in patients with preexisting bundle branch block, development of atrial flutter with a 1 to 1 conduction to the ventricles may resemble ventricular tachycardia at first glance.
Atrial flutter may develope in patients taking propafenone for recurrent episodes of atrial fibrillation (both classical and atypical electrocardiographic and atrial activation patterns have been described)
Caution
When its rate is slowed by medication, atrial flutter may mimick sinus rhythm with 1st degree AV block, at first glance (flutter waves may be falsely perceived as P waves).
References
Indian Pacing Electrophysiol J 2010;10:278-280.
Heart 2001;85:424-429.
Chou's Electrocardiography in Clinical Practice. Adult and Pediatric.

ECG 1a. The rhythm strip in a patient with atrial flutter just before electrical cardioversion.
Flutter waves are best seen in lead aVF.
Click here for a more detailed ECG

ECG 1b. The ECG of the same patient immediately after successful electrical cardioversion with biphasic 200 Joules.
Click here for a more detailed ECG

ECG 2. On Holter recordings, the flutter waves (sawtooth appearance) may not always be easy to recognize.
This is the Holter recording of the patient whose ECGs before and after the electrical cardioversion are depicted above.
Click here for a more detailed ECG

ECG 3. Atrial flutter with variable block in a mitral stenosis patient under beta blocker therapy.
Click here for a more detailed ECG

ECG 4. Atrial flutter in a patient with permanent cardiac pacemaker. Red arrows show flutter waves.
Click here for a more detailed ECG

ECG 5. Atrial flutter. Isoelectric baseline is not observed in leads II, III and aVF due to flutter waves.
Click here for a more detailed ECG

ECG 6a. Atrial flutter with 2:1 block. Flutter waves are best seen in leads II and aVF. Isoelectric baseline is not seen in lead D2.
Flutter waves are not clearly seen in chest leads.
Click here for a more detailed ECG

ECG 6b. 4:1 block is observed in the same patient on another day. The block became 2:1 for only once.
Since the block has increased to 4:1, flutter waves can be clearly seen in chest leads (C1-C6).
Click here for a more detailed ECG

ECG 7. In this ECG, it is difficult to see the flutter waves at a first glance. The regular and rapid flutter waves in C1 confirm that
the rhythm is atrial flutter. Some flutter waves are not seen since they coincide with the QRS complexes.
Click here for a more detailed ECG

ECG 8. Atrial flutter. The block varies regularly.
Click here for a more detailed ECG

ECG 9a. Atrial flutter with 2:1 AV block. The patient complains of fatigue but not palpitation.
Heart rate is about 155/minute.
Click here for a more detailed ECG

ECG 9b. Two hours after ingestion of 80 mg of Sotalol, the block level is increased. At times, the AV block becomes 3:1 or 4:1.
Click here for a more detailed ECG

ECG 10. The ECG above belongs to a 14 years-old boy with restrictive cardiomyopathy who is awaiting cardiac transplantation.
The rhythm is atrial flutter with variable degrees of AV block.
Pediatric cardiologist Dr. Mahmut Gokdemir has donated the above ECG to our website.
Click here for a more detailed ECG

ECG 11. The ECG above is from a child with narrow QRS tachycardia. It was recorded during Adenosine infusion.
Adenosine-induced transient AV block permitted the clear observation of P waves: atrial flutter.
Pediatric cardiologist Prof. Dr. Birgul Varan has donated the above ECG to our website.
Click here for a more detailed ECG

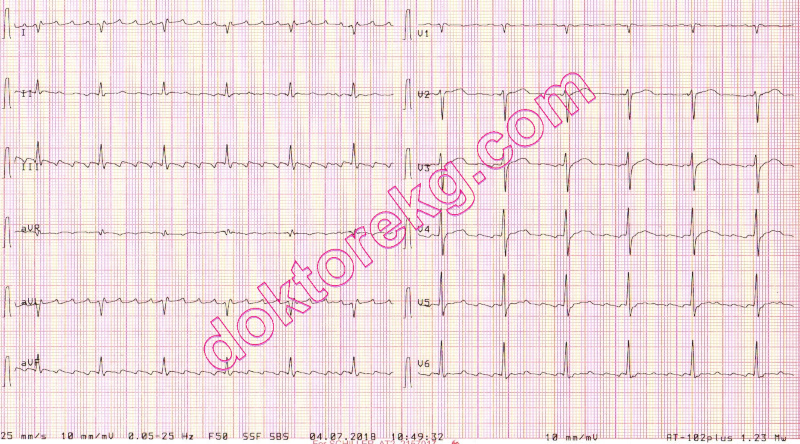
ECG 12. The ECG above belongs to an 80 years-old man. The atrial rate is around 330/minute.
Comment by Dr. Fred Kusumoto:
Probable left sided atrial flutter-which often is characterized by minimal flutter deflections observed in the frontal axis.
The positive flutter wave in V1 suggests that the exit site of the circuit is from the posterior LA near the pulmonary veins.
You do not know whether this is an automatic atrial tachycardia (thus the isoelectric period) or
more likely a left atrial flutter with atrial myopathy and a "horizontal" depolarization pattern of the atria
thus leading to minimal deflections observed in the other leads.
Click here for a more detailed ECG

ECG 13. The ECG above belongs to a middle-aged hypertensive woman. Left ventricular strain pattern is evident.
Is the rhythm atrial flutter or atrial tachycardia?
Comment by Dr. Fred Kusumoto:
The distinction between atrial flutter and atrial tachycardia is very difficult to make.
An isoelectric period between atrial deflections favors an automatic atrial tachycardia,
but some atrial flutters can have isoelectric periods because there is a region of the circuit
that does not lead to circumscribed flutter waves (either a protected isthmus with very slow conduction) or
an atrial depolarization vector that is not well seen with the usual 12 leads
Click here for a more detailed ECG

ECG 14a. The ECG above is from a one day-old newborn. The rhythm is atrial flutter with variable AV block.
The tracing is recorded at a standard paper speed of 25 mm/second.
Pediatric cardiologist Dr. Mahmut Gokdemir has donated the above ECG to our website.
Click here for a more detailed ECG

ECG 14b. The ECG above is from the same one day-old newborn with atrial flutter.
This time, it is recorded at a paper speed of 50 mm/second.
Pediatric cardiologist Dr. Mahmut Gokdemir has donated the above ECG to our website.
Click here for a more detailed ECG

ECG 15. The above ECG shows 2:1 atrial flutter. Flutter waves are seen only in lead V1.
Esra Dogan has donated the above ECG to our website.
Click here for a more detailed ECG

ECG 16. The above ECG shows coexistence of ventricular pacing and atrial flutter.
Flutter waves are seen only in lead V1.
Pacemaker spikes are barely visible in some of the leads.
The pacemaker is functioning normally.
Underlying atrial flutter has nothing to do with ventricular pacing.
Esra Dogan has donated the above ECG to our website.
Click here for a more detailed ECG
ECG 17. Atrial flutter in a patient with permanent pacemaker.
Red arrows show the flutter waves.
Click here for a more detailed ECG

ECG 18. Above ECG is from a 26 years-old man with atrial flutter.
It was recorded during Valsalva maneuver which resulted in temporary slowing of the ventricular rate
making flutter waves more evident.
Click here for a more detailed ECG

ECG 19a. The ECG above is form a 31 years-old man who was admitted to the Emergency Room with the complaint
of palpitation. Wide QRS complex tachycardia is seen. The ventricular rate is 216/minute. Is it ventricular tachycardia?
This ECG was recorded just before intravenous injection of 10 mg Adenosine.
Click here for a more detailed ECG

ECG 19b. The ECG above belongs to the same patient. It was recorded during intravenous injection of 10 mg Adenosine.
Temporary atrioventricular (AV) block during Adenosine injection reveals the underlying rhythm as atrial flutter.
The mid part of the ECG shows 4:1 AV block. As the effect of Adenosine decreases rapidly, first 3:1 then 2:1 AV block is seen.
The right side of the ECG shows atrial flutter with a 1:1 conduction.
Click here for a more detailed ECG

ECG 19c. The above ECG was recorded immediately after recording the ECG 5b.
Since Adenosine half-life is less than 10 seconds, the heart rate becomes 216/minute again.
In this case, Adenosine did not convert the arrhythmia but easily showed that the rhythm was atrial flutter.
Click here for a more detailed ECG

ECG 19d. The ECG above belongs to the same patient. It was recorded after 3 hours of i.v. Amiodarone infusion.
(The patient was offered electrical cardioversion but he refused it)
The rhythm is atrial flutter with 2:1 AV block. Saw-tooth appearence is clearly seen in leads II and aVF.
Click here for a more detailed ECG

ECG 19e. The rhythm tracing above belongs to the same patient.
It was recorded immediately after the ECG 5d, but at at a paper speed of 50 mm/second.
Click here for a more detailed ECG

ECG 20a. The ECG above belongs to a 74 years-old man with chronic atrial flutter.
He does not have heart failure.
Normal electrode placement shows prominent flutter waves only in lead V1.
Click here for a more detailed ECG
ECG 20b. The ECG above belongs to the same patient. It was recorded after Lewis modification.
Now, prominent flutter waves are seen in leads I, III, aVL and aVF.
Click here for a more detailed ECG

ECG 21. The ECG above is from a 76 years-old woman. It was recorded one month after her mitral valve replacement.
At first glance, the lead V1 may suggest the presence of right bundle branch block (RBBB).
The R'-like wave immediately after the R wave in lead V1 is actually a flutter wave.
Flutter waves with 2:1 AV block mimick RBBB in this patient. Actually there is no RBBB.
Click here for a more detailed ECG

ECG 22a. The ECG above belongs to a 48 years-old man. He had undergone Bentall operation 5 days ago.
Wide-QRS tachycardia in the form of left bundle branch block is seen. Is it ventricular tachycardia (VT ?)
Dr. Erkan Kısacık has donated the above ECG to our website.
Click here for a more detailed ECG

ECG 22b. The ECG above belongs to the same patient. It was recorded after electrical cardioversion with 50 Joules.
Now, the rhythm is sinus. Left bundle branch block is also seen.
Later on, electrophysiologic study (EPS) revealed atrial flutter with 1:1 conduction.
The ECG 22a was actually atrial flutter with a 1:1 conduction to the ventricles.
Every wide QRS tachycardia is not necessarily a VT.
Dr. Sinan Altan Kocaman has donated the above ECG to our website.
Click here for a more detailed ECG

ECG 23a. The ECG above belongs to a 16 years-old male who had previously undergone Fontan operation.
He has been under Sotalol therapy for a long time.
Do you think the PR interval is prolonged when you look at leads V1 and V2?
In fact, the rhythm is not sinus rhythm and we cannot talk about PR interval.
The seemingly "P waves" in leads V1 and V2 are actually flutter waves.
The flutter waves are best seen in lead II.
The rhythm is 2:1 atrial flutter and half of the flutter waves are buried in QRS complexes.
The ventricular rate is 104/minute. When a patient with atrial flutter is under Sotalol or Amiodarone therapy,
even if the rhythm is not converted to sinus, ventricular rate is usually lower than pre-treatment levels.
Don't let the "relatively slow" heart rate deceive you in diagnosing the rhythm.
In a patient with 2:1 atrial flutter, if pre-treatment ventricular rate is about 125-150/min, it may decrease to 100-110/minute
after treatment with Sotalol or Amiodarone.
Click here for a more detailed ECG

ECG 23b. The ECG above belongs to the same patient. It was recorded 2 years after the ECG 23a.
He is still taking 2 x 80 mg Sotalol per day.
The rhythm is sinus and we can talk about PR interval now. The PR interval is normal. No flutter waves are seen.
Unlike the ECG 23a, P wave, QRS complex and T wave in lead II are clearly identifiable in ECG 23b.
The ventricular rate is 57/minute now. If a patient with sinus rhythm is under Sotalol or Amiodarone therapy,
generally expect to see low heart rates (as is the case in this patient).
The last beat is an atrial premature beat.
Click here for a more detailed ECG

ECG 24. The above ECG is from an 84 years-old woman with Parkinson's disease.
At first glance, the rhythm may seem like atrial flutter (especially when looked at leads II, III and aVF).
However, the seemingly flutter waves are not regular, this reminds us that they are not flutter waves.
They are due to tremor artitact.
P, QRS and T waves are clearly seen in lead I.
ECG computer falsely diagnosed this tremor artifact as "ectopic atrial tachycardia".
Click here for a more detailed ECG

ECG 25. The ECG above belongs to a 90 years-old woman (a different patient).
This ECG was recorded 1 week after her coronary artery bypass grafting surgery.
At first glance, it may look like the ECG 24a, however, the rhythm of this ECG is really atrial flutter.
(with variable block). There is no tremor artifact.
Flutter waves are best seen in leads II, III and aVF. Unlike the ECG 24a, the real flutter waves in the ECG 24b
are regular. Also, most leads of the ECG 24b do not clearly show P waves, T waves or PR interval.
Click here for a more detailed ECG

ECG 26a. The ECG above belongs to a 45 years-old hypertensive man.
He had undergone aortic and mitral valve replacement operation years ago.
Now, he also has significant tricuspid valve stenosis.
What is his rhythm? Can you see P waves?
If the heart rate is 110-130/minute and P waves are not clearly visible, the possibility of
atrial flutter must be remembered. In such a situation, carotid sinus massage or intravenous Adenosine administration
may increase the level of AV block and make flutter waves clearly visible.
Click here for a more detailed ECG

ECG 26b. The ECG above belongs to the same man. It was recorded 11 minutes after the ECG 26a.
Flutter waves are easily noticeable when the level of AV block increases.
Some flutter waves may be difficult to notice when they are close to QRS complexes.
Click here for a more detailed ECG

ECG 27. Sometimes, the amplitudes of T and P waves may be similar, mimicking the sawtooth appearance in atrial flutter,
at first glance. The TP interval and the PT intervals are not same in the above ECG.
Isoelectric lines between T and P waves are clearly seen.
The rhythm in the above ECG is not atrial flutter.
Click here for a more detailed ECG

ECG 28a. The ECG above belongs to a 66 years-old woman with coronary artery disease and mitral valve prosthesis.
She had undergone coronary artery bypass grafting operation and mitral valve replacement 2 weeks ago.
She had experienced inferoposterior wall myocardial infarction before the operation.
Now she has left ventricular systolic dysfunction with Ejection Fraction (EF) of 35%.
She is under Bisoprolol (beta blocker) therapy.
Her heart rate is 110/minute.
What is the rhythm? Is it sinus tachycardia?
Click here for a more detailed ECG

ECG 28b. The ECG above belongs to the same woman. It was recorded 3 weeks after the ECG 28a.
This ECG was recorded at a standard calibration of 10 mm/mV and at a paper speed of 25 mm/second.
After 3 weeks, her heart rate is almost the same: 111/minute.
She is still taking Bisoprolol (beta blocker).
What is the rhythm? Is it sinus tachycardia?
Do you see P waves? Is there a normal PR interval?
Click here for a more detailed ECG

ECG 28c. The ECG above belongs to the same woman. It was recorded immediately after the ECG 28b.
To see the details clearly, the calibration was now set at 20 mm/mV.
Her heart rate is 110/minute.
Seemingly P waves in lead V1 are in fact flutter waves.
Flutter waves deform terminal portion of the QRS complexes in inferior leads.
The rhythm is atrial flutter, not sinus tachycardia.
Click here for a more detailed ECG

ECG 28d. The ECG above belongs to the same woman.
It was recorded 24 hours after the onset of intravenous Amiodarone infusion.
This ECG was recorded at a standard calibration of 10 mm/mV and at a paper speed of 25 mm/second.
Now the heart rate is 92/minute.
Is it sinus rhythm with prolonged PR interval (1st degree atrioventricular block)?
Please look at the ECG 28e below.
Click here for a more detailed ECG

ECG 28e. The ECG above belongs to the same woman. It was recorded just before the ECG 28d.
This time, the calibration was set to 20 mm/mV to see the details clearly.
Her heart rate is 93/minute.
Seemingly P waves in lead V1 are in fact flutter waves.
Some flutter waves deform terminal portion of the QRS complexes, especially in lead V1.
The rhythm is atrial flutter (slowed by Amiodarone therapy), not sinus rhythm with 1st degree atrioventricular block.
Click here for a more detailed ECG

ECG 28f. The ECG above belongs to the same woman. It was recorded 9 days after the ECG 28e.
This time, the rhythm is sinus tachycardia with a heart rate of 104/minute.
Leads II and V1 clearly show P waves with normal PR interval.
Click here for a more detailed ECG

ECG 29a. The ECG above belongs to a 70 years-old hypertensive woman with coronary artery disease.
She complains of palpitation.
The above ECG was recorded in another hospital and the patient was referred to our clinic.
It was recorded at a standard calibration of 10 mm/mV and at a standard paper speed of 25 mm/sec.
Click here for a more detailed ECG

ECG 29b. The ECG above belongs to the same woman.
It was recorded in our clinic, on the same day with the ECG 29a.
Its calibration is 10 mm/mV at a paper speed of 25 mm/sec (standard settings).
Do you see P waves? Is this rhythm sinus tachycardia?
Click here for a more detailed ECG

ECG 29c. The 6-channel rhythm tracing above belongs to the same woman.
It was recorded in our clinic immediately after the ECG 29b.
To see flutter waves clearly, the paper speed was set at 50 mm/second.
The rhythm is atrial flutter, not sinus tachycardia.
Click here for a more detailed ECG

ECG 29d. The 6-channel rhythm tracing above belongs to the same woman.
It was recorded immediately after the ECG 29c.
It was recorded at a calibration of 20 mm/mV and a paper speed of 50 mm/second.
Now flutter waves are seen clearly.
The rhythm is atrial flutter, not sinus tachycardia.
Click here for a more detailed ECG
Diagnostic criteria
This is a regular atrial arrhythmia with an atrial rate of 250-350/minute.
Usually, there is no isoelectric baseline between atrial deflections (P waves). The high rate of atrial deflections result in "sawtooth" appearance.
Flutter waves are best seen in leads II, III and aVF.
All flutter waves cannot be conducted to ventricles. Usually there is a 2:1, 3:1 or 4:1 AV block. Sometimes, level of block may change spontaneously.
Even though the block may vary, atrial flutter is still accepted as a regularly irregular arrhythmia since level of block is not completely irregular.
When needed, Lewis lead modification may be used to see flutter waves more clearly.
Clinical significance
Holter recordings may show alternating episodes of atrial flutter and atrial fibrillation in the same patient.
The ventricular rate is expected to be low in patients receiving high dose digoxin, amiodarone or beta blocker therapy.
The pharmacological control of ventricular rate is more difficult in atrial flutter than atrial fibrillation.
Atrial flutter usually occurs in subjects with organic heart diseases. On the other hand, atrial fibrillation may be seen in patients without organic heart diseases.
Atrial flutter is less common than atrial fibrillation in adults but more common in children.
In patients with preexisting bundle branch block, development of supraventricular tachycardia may resemble ventricular tachycardia at first glance. Similarly, in patients with preexisting bundle branch block, development of atrial flutter with a 1 to 1 conduction to the ventricles may resemble ventricular tachycardia at first glance.
Atrial flutter may develope in patients taking propafenone for recurrent episodes of atrial fibrillation (both classical and atypical electrocardiographic and atrial activation patterns have been described)
Caution
When its rate is slowed by medication, atrial flutter may mimick sinus rhythm with 1st degree AV block, at first glance (flutter waves may be falsely perceived as P waves).
References
Indian Pacing Electrophysiol J 2010;10:278-280.
Heart 2001;85:424-429.
Chou's Electrocardiography in Clinical Practice. Adult and Pediatric.
ECG 1a. The rhythm strip in a patient with atrial flutter just before electrical cardioversion.
Flutter waves are best seen in lead aVF.
Click here for a more detailed ECG
ECG 1b. The ECG of the same patient immediately after successful electrical cardioversion with biphasic 200 Joules.
Click here for a more detailed ECG
ECG 2. On Holter recordings, the flutter waves (sawtooth appearance) may not always be easy to recognize.
This is the Holter recording of the patient whose ECGs before and after the electrical cardioversion are depicted above.
Click here for a more detailed ECG
ECG 3. Atrial flutter with variable block in a mitral stenosis patient under beta blocker therapy.
Click here for a more detailed ECG
ECG 4. Atrial flutter in a patient with permanent cardiac pacemaker. Red arrows show flutter waves.
Click here for a more detailed ECG
ECG 5. Atrial flutter. Isoelectric baseline is not observed in leads II, III and aVF due to flutter waves.
Click here for a more detailed ECG
ECG 6a. Atrial flutter with 2:1 block. Flutter waves are best seen in leads II and aVF. Isoelectric baseline is not seen in lead D2.
Flutter waves are not clearly seen in chest leads.
Click here for a more detailed ECG
ECG 6b. 4:1 block is observed in the same patient on another day. The block became 2:1 for only once.
Since the block has increased to 4:1, flutter waves can be clearly seen in chest leads (C1-C6).
Click here for a more detailed ECG
ECG 7. In this ECG, it is difficult to see the flutter waves at a first glance. The regular and rapid flutter waves in C1 confirm that
the rhythm is atrial flutter. Some flutter waves are not seen since they coincide with the QRS complexes.
Click here for a more detailed ECG
ECG 8. Atrial flutter. The block varies regularly.
Click here for a more detailed ECG
ECG 9a. Atrial flutter with 2:1 AV block. The patient complains of fatigue but not palpitation.
Heart rate is about 155/minute.
Click here for a more detailed ECG
ECG 9b. Two hours after ingestion of 80 mg of Sotalol, the block level is increased. At times, the AV block becomes 3:1 or 4:1.
Click here for a more detailed ECG
ECG 10. The ECG above belongs to a 14 years-old boy with restrictive cardiomyopathy who is awaiting cardiac transplantation.
The rhythm is atrial flutter with variable degrees of AV block.
Pediatric cardiologist Dr. Mahmut Gokdemir has donated the above ECG to our website.
Click here for a more detailed ECG
ECG 11. The ECG above is from a child with narrow QRS tachycardia. It was recorded during Adenosine infusion.
Adenosine-induced transient AV block permitted the clear observation of P waves: atrial flutter.
Pediatric cardiologist Prof. Dr. Birgul Varan has donated the above ECG to our website.
Click here for a more detailed ECG
ECG 12. The ECG above belongs to an 80 years-old man. The atrial rate is around 330/minute.
Comment by Dr. Fred Kusumoto:
Probable left sided atrial flutter-which often is characterized by minimal flutter deflections observed in the frontal axis.
The positive flutter wave in V1 suggests that the exit site of the circuit is from the posterior LA near the pulmonary veins.
You do not know whether this is an automatic atrial tachycardia (thus the isoelectric period) or
more likely a left atrial flutter with atrial myopathy and a "horizontal" depolarization pattern of the atria
thus leading to minimal deflections observed in the other leads.
Click here for a more detailed ECG
ECG 13. The ECG above belongs to a middle-aged hypertensive woman. Left ventricular strain pattern is evident.
Is the rhythm atrial flutter or atrial tachycardia?
Comment by Dr. Fred Kusumoto:
The distinction between atrial flutter and atrial tachycardia is very difficult to make.
An isoelectric period between atrial deflections favors an automatic atrial tachycardia,
but some atrial flutters can have isoelectric periods because there is a region of the circuit
that does not lead to circumscribed flutter waves (either a protected isthmus with very slow conduction) or
an atrial depolarization vector that is not well seen with the usual 12 leads
Click here for a more detailed ECG
ECG 14a. The ECG above is from a one day-old newborn. The rhythm is atrial flutter with variable AV block.
The tracing is recorded at a standard paper speed of 25 mm/second.
Pediatric cardiologist Dr. Mahmut Gokdemir has donated the above ECG to our website.
Click here for a more detailed ECG
ECG 14b. The ECG above is from the same one day-old newborn with atrial flutter.
This time, it is recorded at a paper speed of 50 mm/second.
Pediatric cardiologist Dr. Mahmut Gokdemir has donated the above ECG to our website.
Click here for a more detailed ECG
ECG 15. The above ECG shows 2:1 atrial flutter. Flutter waves are seen only in lead V1.
Esra Dogan has donated the above ECG to our website.
Click here for a more detailed ECG
ECG 16. The above ECG shows coexistence of ventricular pacing and atrial flutter.
Flutter waves are seen only in lead V1.
Pacemaker spikes are barely visible in some of the leads.
The pacemaker is functioning normally.
Underlying atrial flutter has nothing to do with ventricular pacing.
Esra Dogan has donated the above ECG to our website.
Click here for a more detailed ECG
ECG 17. Atrial flutter in a patient with permanent pacemaker.
Red arrows show the flutter waves.
Click here for a more detailed ECG
ECG 18. Above ECG is from a 26 years-old man with atrial flutter.
It was recorded during Valsalva maneuver which resulted in temporary slowing of the ventricular rate
making flutter waves more evident.
Click here for a more detailed ECG
ECG 19a. The ECG above is form a 31 years-old man who was admitted to the Emergency Room with the complaint
of palpitation. Wide QRS complex tachycardia is seen. The ventricular rate is 216/minute. Is it ventricular tachycardia?
This ECG was recorded just before intravenous injection of 10 mg Adenosine.
Click here for a more detailed ECG
ECG 19b. The ECG above belongs to the same patient. It was recorded during intravenous injection of 10 mg Adenosine.
Temporary atrioventricular (AV) block during Adenosine injection reveals the underlying rhythm as atrial flutter.
The mid part of the ECG shows 4:1 AV block. As the effect of Adenosine decreases rapidly, first 3:1 then 2:1 AV block is seen.
The right side of the ECG shows atrial flutter with a 1:1 conduction.
Click here for a more detailed ECG
ECG 19c. The above ECG was recorded immediately after recording the ECG 5b.
Since Adenosine half-life is less than 10 seconds, the heart rate becomes 216/minute again.
In this case, Adenosine did not convert the arrhythmia but easily showed that the rhythm was atrial flutter.
Click here for a more detailed ECG
ECG 19d. The ECG above belongs to the same patient. It was recorded after 3 hours of i.v. Amiodarone infusion.
(The patient was offered electrical cardioversion but he refused it)
The rhythm is atrial flutter with 2:1 AV block. Saw-tooth appearence is clearly seen in leads II and aVF.
Click here for a more detailed ECG
ECG 19e. The rhythm tracing above belongs to the same patient.
It was recorded immediately after the ECG 5d, but at at a paper speed of 50 mm/second.
Click here for a more detailed ECG
ECG 20a. The ECG above belongs to a 74 years-old man with chronic atrial flutter.
He does not have heart failure.
Normal electrode placement shows prominent flutter waves only in lead V1.
Click here for a more detailed ECG
ECG 20b. The ECG above belongs to the same patient. It was recorded after Lewis modification.
Now, prominent flutter waves are seen in leads I, III, aVL and aVF.
Click here for a more detailed ECG
ECG 21. The ECG above is from a 76 years-old woman. It was recorded one month after her mitral valve replacement.
At first glance, the lead V1 may suggest the presence of right bundle branch block (RBBB).
The R'-like wave immediately after the R wave in lead V1 is actually a flutter wave.
Flutter waves with 2:1 AV block mimick RBBB in this patient. Actually there is no RBBB.
Click here for a more detailed ECG
ECG 22a. The ECG above belongs to a 48 years-old man. He had undergone Bentall operation 5 days ago.
Wide-QRS tachycardia in the form of left bundle branch block is seen. Is it ventricular tachycardia (VT ?)
Dr. Erkan Kısacık has donated the above ECG to our website.
Click here for a more detailed ECG
ECG 22b. The ECG above belongs to the same patient. It was recorded after electrical cardioversion with 50 Joules.
Now, the rhythm is sinus. Left bundle branch block is also seen.
Later on, electrophysiologic study (EPS) revealed atrial flutter with 1:1 conduction.
The ECG 22a was actually atrial flutter with a 1:1 conduction to the ventricles.
Every wide QRS tachycardia is not necessarily a VT.
Dr. Sinan Altan Kocaman has donated the above ECG to our website.
Click here for a more detailed ECG
ECG 23a. The ECG above belongs to a 16 years-old male who had previously undergone Fontan operation.
He has been under Sotalol therapy for a long time.
Do you think the PR interval is prolonged when you look at leads V1 and V2?
In fact, the rhythm is not sinus rhythm and we cannot talk about PR interval.
The seemingly "P waves" in leads V1 and V2 are actually flutter waves.
The flutter waves are best seen in lead II.
The rhythm is 2:1 atrial flutter and half of the flutter waves are buried in QRS complexes.
The ventricular rate is 104/minute. When a patient with atrial flutter is under Sotalol or Amiodarone therapy,
even if the rhythm is not converted to sinus, ventricular rate is usually lower than pre-treatment levels.
Don't let the "relatively slow" heart rate deceive you in diagnosing the rhythm.
In a patient with 2:1 atrial flutter, if pre-treatment ventricular rate is about 125-150/min, it may decrease to 100-110/minute
after treatment with Sotalol or Amiodarone.
Click here for a more detailed ECG
ECG 23b. The ECG above belongs to the same patient. It was recorded 2 years after the ECG 23a.
He is still taking 2 x 80 mg Sotalol per day.
The rhythm is sinus and we can talk about PR interval now. The PR interval is normal. No flutter waves are seen.
Unlike the ECG 23a, P wave, QRS complex and T wave in lead II are clearly identifiable in ECG 23b.
The ventricular rate is 57/minute now. If a patient with sinus rhythm is under Sotalol or Amiodarone therapy,
generally expect to see low heart rates (as is the case in this patient).
The last beat is an atrial premature beat.
Click here for a more detailed ECG
ECG 24. The above ECG is from an 84 years-old woman with Parkinson's disease.
At first glance, the rhythm may seem like atrial flutter (especially when looked at leads II, III and aVF).
However, the seemingly flutter waves are not regular, this reminds us that they are not flutter waves.
They are due to tremor artitact.
P, QRS and T waves are clearly seen in lead I.
ECG computer falsely diagnosed this tremor artifact as "ectopic atrial tachycardia".
Click here for a more detailed ECG
ECG 25. The ECG above belongs to a 90 years-old woman (a different patient).
This ECG was recorded 1 week after her coronary artery bypass grafting surgery.
At first glance, it may look like the ECG 24a, however, the rhythm of this ECG is really atrial flutter.
(with variable block). There is no tremor artifact.
Flutter waves are best seen in leads II, III and aVF. Unlike the ECG 24a, the real flutter waves in the ECG 24b
are regular. Also, most leads of the ECG 24b do not clearly show P waves, T waves or PR interval.
Click here for a more detailed ECG
ECG 26a. The ECG above belongs to a 45 years-old hypertensive man.
He had undergone aortic and mitral valve replacement operation years ago.
Now, he also has significant tricuspid valve stenosis.
What is his rhythm? Can you see P waves?
If the heart rate is 110-130/minute and P waves are not clearly visible, the possibility of
atrial flutter must be remembered. In such a situation, carotid sinus massage or intravenous Adenosine administration
may increase the level of AV block and make flutter waves clearly visible.
Click here for a more detailed ECG
ECG 26b. The ECG above belongs to the same man. It was recorded 11 minutes after the ECG 26a.
Flutter waves are easily noticeable when the level of AV block increases.
Some flutter waves may be difficult to notice when they are close to QRS complexes.
Click here for a more detailed ECG
ECG 27. Sometimes, the amplitudes of T and P waves may be similar, mimicking the sawtooth appearance in atrial flutter,
at first glance. The TP interval and the PT intervals are not same in the above ECG.
Isoelectric lines between T and P waves are clearly seen.
The rhythm in the above ECG is not atrial flutter.
Click here for a more detailed ECG
ECG 28a. The ECG above belongs to a 66 years-old woman with coronary artery disease and mitral valve prosthesis.
She had undergone coronary artery bypass grafting operation and mitral valve replacement 2 weeks ago.
She had experienced inferoposterior wall myocardial infarction before the operation.
Now she has left ventricular systolic dysfunction with Ejection Fraction (EF) of 35%.
She is under Bisoprolol (beta blocker) therapy.
Her heart rate is 110/minute.
What is the rhythm? Is it sinus tachycardia?
Click here for a more detailed ECG
ECG 28b. The ECG above belongs to the same woman. It was recorded 3 weeks after the ECG 28a.
This ECG was recorded at a standard calibration of 10 mm/mV and at a paper speed of 25 mm/second.
After 3 weeks, her heart rate is almost the same: 111/minute.
She is still taking Bisoprolol (beta blocker).
What is the rhythm? Is it sinus tachycardia?
Do you see P waves? Is there a normal PR interval?
Click here for a more detailed ECG
ECG 28c. The ECG above belongs to the same woman. It was recorded immediately after the ECG 28b.
To see the details clearly, the calibration was now set at 20 mm/mV.
Her heart rate is 110/minute.
Seemingly P waves in lead V1 are in fact flutter waves.
Flutter waves deform terminal portion of the QRS complexes in inferior leads.
The rhythm is atrial flutter, not sinus tachycardia.
Click here for a more detailed ECG
ECG 28d. The ECG above belongs to the same woman.
It was recorded 24 hours after the onset of intravenous Amiodarone infusion.
This ECG was recorded at a standard calibration of 10 mm/mV and at a paper speed of 25 mm/second.
Now the heart rate is 92/minute.
Is it sinus rhythm with prolonged PR interval (1st degree atrioventricular block)?
Please look at the ECG 28e below.
Click here for a more detailed ECG
ECG 28e. The ECG above belongs to the same woman. It was recorded just before the ECG 28d.
This time, the calibration was set to 20 mm/mV to see the details clearly.
Her heart rate is 93/minute.
Seemingly P waves in lead V1 are in fact flutter waves.
Some flutter waves deform terminal portion of the QRS complexes, especially in lead V1.
The rhythm is atrial flutter (slowed by Amiodarone therapy), not sinus rhythm with 1st degree atrioventricular block.
Click here for a more detailed ECG
ECG 28f. The ECG above belongs to the same woman. It was recorded 9 days after the ECG 28e.
This time, the rhythm is sinus tachycardia with a heart rate of 104/minute.
Leads II and V1 clearly show P waves with normal PR interval.
Click here for a more detailed ECG
ECG 29a. The ECG above belongs to a 70 years-old hypertensive woman with coronary artery disease.
She complains of palpitation.
The above ECG was recorded in another hospital and the patient was referred to our clinic.
It was recorded at a standard calibration of 10 mm/mV and at a standard paper speed of 25 mm/sec.
Click here for a more detailed ECG
ECG 29b. The ECG above belongs to the same woman.
It was recorded in our clinic, on the same day with the ECG 29a.
Its calibration is 10 mm/mV at a paper speed of 25 mm/sec (standard settings).
Do you see P waves? Is this rhythm sinus tachycardia?
Click here for a more detailed ECG
ECG 29c. The 6-channel rhythm tracing above belongs to the same woman.
It was recorded in our clinic immediately after the ECG 29b.
To see flutter waves clearly, the paper speed was set at 50 mm/second.
The rhythm is atrial flutter, not sinus tachycardia.
Click here for a more detailed ECG
ECG 29d. The 6-channel rhythm tracing above belongs to the same woman.
It was recorded immediately after the ECG 29c.
It was recorded at a calibration of 20 mm/mV and a paper speed of 50 mm/second.
Now flutter waves are seen clearly.
The rhythm is atrial flutter, not sinus tachycardia.
Click here for a more detailed ECG