doktorekg.com
ECG in Hyperkalemia (Hyperpotassemia)
ECG findings in hyperkalemia
 P wave disappears or decreases in amplitude.
PR interval increases.
QRS complex widens.
QT interval shortens.
Sharp, pointed T wave with a narrow base.
The ECG findings of hyperkalemia have low sensitivity and low spesificity.
Failure to observe these findings do not exclude the presence of hyperkalemia.
Rare ECG abnormities due to hyperkalemia
Nodal rhythm (junctional rhythm).
ST-segment alternans
Left anterior fascicular block
Right bundle branch block
Left bundle branch block
Brugada-like electrocardiographic patterns
Spontaneous conversion of atrial fibrillation
Wide QRS tachycardia
Giant negative T waves (after treatment of hyperkalemia).
Clinical significance
Sinus tachycardia in a chronic renal failure patient with hyperkalemia may be erroneously diagnosed as ventricular tachycardia. Hyperkalemia must be remembered in the differential diagnosis of wide-QRS tachycardia.
References
Chou's Electrocardiography in Clinical Practice. Adult and Pediatric. 5th ed. Philadelphia. WB Saunders. 2001.
Circulation 1956;13(1):29-36.
Cardiol Res 2017;8(2):77-80.
Clin Cardiol 1981;4(1):43-46.
Neth Heart J 2016;24(3):217-218.
J Pediatr 1979;94(4):654-656.
Medicine (Baltimore) 2018;97(15):e0442.
Intern Med 2017;56(16):2243-2244.
Neth Heart J 2003;11(6):268-271
Medicina (Kaunas) 2013;49(3):148-153.
J Electrocardiol 2007;40(1):53-59.
Case Rep Cardiol 2017;2017:9464728.

ECG 1a. ECG of a chronic renal failure patient immediately before hemodialysis. Serum potassium level is 7.1 mEq/L.
Click here for a more detailed ECG

ECG 1b. ECG of the same patient immediately after hemodialysis. Serum potassium level is 4.0 mEq/L.
Click here for a more detailed ECG

ECG 2a. The pre-dialysis ECG of another patient with serum potassium level of 6.6 mEq/L.
Click here for a more detailed ECG
ECG 2b. The ECG of the same patient after hemodialysis. The serum potassium level is 3.6 mEq/L.
Click here for a more detailed ECG

ECG 3a. The ECG above belongs to a patient who refused to undergo hemodialysis for 10 days.
Before hemodialysis, serum potassium level was 9 mEq/L while serum calcium level was 7.8 mg/dL.
ECG signs of both hyperkalemia and hypocalcemia are seen.
Dr. Muazzez Isik has donated the above ECG to our website.
Click here for a more detailed ECG

ECG 3b. The same patient's ECG after hemodialysis is seen above.
Postdialysis serum levels of potassium is 4.6 mEq/L while calcium is 10.5 mg/dL.
Dr. Muazzez Isik has donated the above ECG to our website.
Click here for a more detailed ECG

ECG 4a. The ECG above belongs to a patient with a serum potassium level of 8.9 mmol/L.
P waves are not seen, QRS complex is widened,
ST segment is absent while the T waves are peaked. (extremity leads).
The ECG is recorded at a paper speed of 50 mm/second, which has contributed to the wide appearance of the QRS complexes.
The above ECG has been donated by Dr. Peter Kukla to our website.
Click here for a more detailed ECG

ECG 4b. Precordial leads of the same patient is seen above.
The ECG is recorded at a paper speed of 50 mm/second, which has contributed to the wide appearance of the QRS complexes.
The above ECG has been donated by Dr. Peter Kukla to our website.
Click here for a more detailed ECG
ECG 5a. The ECG above belongs to an 85 years-old woman with mild aortic stenosis and a serum potassium level of 7 mmol/L.
There is right bundle branch block, The amplitude of the P wave in lead II is diminished.
Click here for a more detailed ECG

ECG 5b. The next day, her serum potassium level was decreased to 5.7 mmol/L and the above ECG was recorded.
Now the P wave amplitude in lead II is higher and the width of the QRS complex in anterior leads are lesser.
Click here for a more detailed ECG

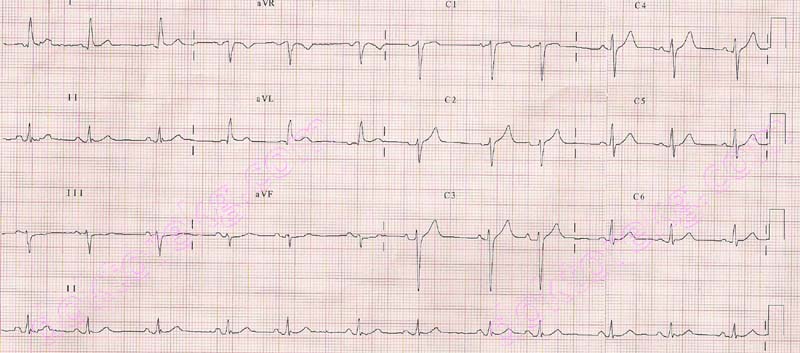
ECG 6. Above is an ECG from a 75 years-old woman with hypertension, COPD, and chronic renal failure.
When the above ECG was recorded, her serum potassium level was measured as 8.6 mmol/L (hyperkalemia).
She was also under Digoxin therapy.
Nodal rhythm is seen. P waves are not visible.
QRS complexes are widened and the T waves in right precordial leads are relatively prominent.
This ECG was recorded at a standart calibration of 25 mm/second.
Hyperkalemia may result in tall, pointed T waves.
In the above ECG, many leads show QRS complexes and T waves with similar amplitudes.
Because of this, the ECG software counts QRS complexes and T waves as seperate QRS complexes,
which results in inadvertently doubling the heart rate as 62/minute.
The actual heart rate in this patient is 31/minute.
Click here for a more detailed ECG

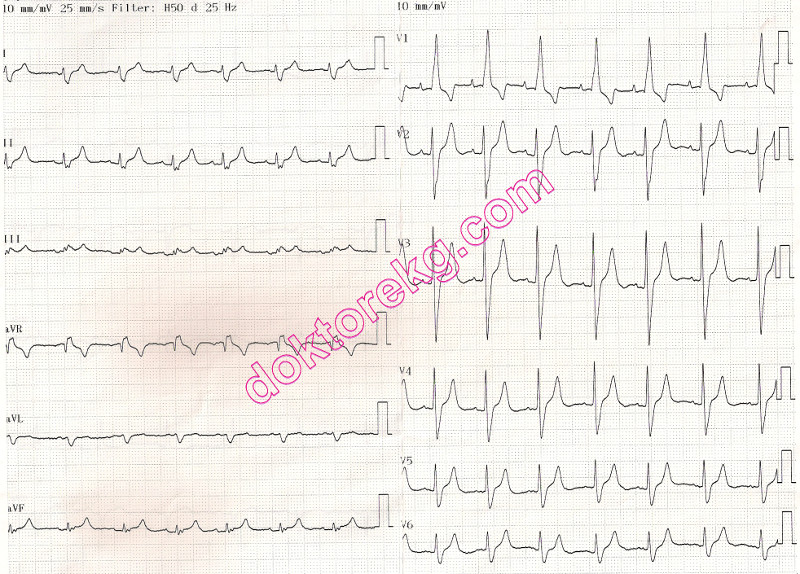
ECG 7a. The ECG above belongs to an 84 years-old woman with chronic renal failure, hyperkalemia (6.9 mmol/L)
and coronary artery disease. This ECG is recorded at a standard calibration of 10 mm/mV.
Click here for a more detailed ECG

ECG 7b. This ECG belongs to the same woman.
It was recorded 30 seconds after the ECG 7a, but at a calibration of 20 mm/mV.
Now P waves are easily discernible. The rhythm is junctional (nodal) rhythm.
Junctional beats do not have preceding P waves.
Some atrial extrasystoles with P waves are also seen.
Click here for a more detailed ECG

ECG 8a. The ECG above belongs to an 65 years-old woman with lung cancer, acute renal failure and right heart failure
(probably due to acute pulmonary embolism).
Her serum potassium level was measured as 8.0 mmol/L while her serum creatinine level was 2.1 mg/dL.
Sharp, pointed T waves with narrow bases and relatively short QT interval should raise the suspicion of hyperkalemia.
Nodal rhythm with no preceding P waves and right bundle branch block are seen.
This ECG was recorded at a standard calibration of 10 mm/mV.
Sometimes pointed tall T waves may be sensed by the ECG software as another QRS complex (as in the above ECG),
resulting in false reporting of the heart rate. On the left upper corner of the above ECG, the heart rate is printed as 109/min.
However, the actual heart rate in this patient is 54/min.
Dr. Sinan Altan Kocaman has donated the above ECG to our website.
Click here for a more detailed ECG

ECG 8b. The above ECG belongs to the same woman. It is recorded after the ECG 8a but at a calibration of 20 mm/mV.
Dr. Sinan Altan Kocaman has donated the above ECG to our website.
Click here for a more detailed ECG

ECG 8c. The 6-channel rhythm tracing above belongs to the same woman. It is recorded shortly after the ECG 8b.
Irregular junctional rhythm (junctional arrhythmia / nodal arrhyhtmia ) is seen.
In leads II, III and aVF, some junctional beats have preceding retrograde P waves with short PR intervals, and some do not.
Calibration is 20m mm/mV.
Dr. Sinan Altan Kocaman has donated the above ECG to our website.
Click here for a more detailed ECG

ECG 9. The ECG above belongs to a 57 years-old man with chronic renal failure and coronary artery disease.
He had undergone coronary artery bypass graft surgery 6 years ago.
The bradycardia is due to his medication: Metoprolol 100mg/day (beta blocker).
When the above ECG was recorded, his serum potassium level was high (5.8 mmol/L).
Narrow-based and pointed T waves in chest leads are seen.
Click here for a more detailed ECG

ECG 10. The ECG above is from a 53 years-old man with chronic renal insufficiency and hypertension.
At the time the above ECG was recorded, her serum potassium level was measured as 6.2 mmol/L.
Peaked T waves with narrow bases are seen.
Click here for a more detailed ECG
P wave disappears or decreases in amplitude.
PR interval increases.
QRS complex widens.
QT interval shortens.
Sharp, pointed T wave with a narrow base.
The ECG findings of hyperkalemia have low sensitivity and low spesificity.
Failure to observe these findings do not exclude the presence of hyperkalemia.
Rare ECG abnormities due to hyperkalemia
Nodal rhythm (junctional rhythm).
ST-segment alternans
Left anterior fascicular block
Right bundle branch block
Left bundle branch block
Brugada-like electrocardiographic patterns
Spontaneous conversion of atrial fibrillation
Wide QRS tachycardia
Giant negative T waves (after treatment of hyperkalemia).
Clinical significance
Sinus tachycardia in a chronic renal failure patient with hyperkalemia may be erroneously diagnosed as ventricular tachycardia. Hyperkalemia must be remembered in the differential diagnosis of wide-QRS tachycardia.
References
Chou's Electrocardiography in Clinical Practice. Adult and Pediatric. 5th ed. Philadelphia. WB Saunders. 2001.
Circulation 1956;13(1):29-36.
Cardiol Res 2017;8(2):77-80.
Clin Cardiol 1981;4(1):43-46.
Neth Heart J 2016;24(3):217-218.
J Pediatr 1979;94(4):654-656.
Medicine (Baltimore) 2018;97(15):e0442.
Intern Med 2017;56(16):2243-2244.
Neth Heart J 2003;11(6):268-271
Medicina (Kaunas) 2013;49(3):148-153.
J Electrocardiol 2007;40(1):53-59.
Case Rep Cardiol 2017;2017:9464728.
ECG 1a. ECG of a chronic renal failure patient immediately before hemodialysis. Serum potassium level is 7.1 mEq/L.
Click here for a more detailed ECG
ECG 1b. ECG of the same patient immediately after hemodialysis. Serum potassium level is 4.0 mEq/L.
Click here for a more detailed ECG
ECG 2a. The pre-dialysis ECG of another patient with serum potassium level of 6.6 mEq/L.
Click here for a more detailed ECG
ECG 2b. The ECG of the same patient after hemodialysis. The serum potassium level is 3.6 mEq/L.
Click here for a more detailed ECG
ECG 3a. The ECG above belongs to a patient who refused to undergo hemodialysis for 10 days.
Before hemodialysis, serum potassium level was 9 mEq/L while serum calcium level was 7.8 mg/dL.
ECG signs of both hyperkalemia and hypocalcemia are seen.
Dr. Muazzez Isik has donated the above ECG to our website.
Click here for a more detailed ECG
ECG 3b. The same patient's ECG after hemodialysis is seen above.
Postdialysis serum levels of potassium is 4.6 mEq/L while calcium is 10.5 mg/dL.
Dr. Muazzez Isik has donated the above ECG to our website.
Click here for a more detailed ECG
ECG 4a. The ECG above belongs to a patient with a serum potassium level of 8.9 mmol/L.
P waves are not seen, QRS complex is widened,
ST segment is absent while the T waves are peaked. (extremity leads).
The ECG is recorded at a paper speed of 50 mm/second, which has contributed to the wide appearance of the QRS complexes.
The above ECG has been donated by Dr. Peter Kukla to our website.
Click here for a more detailed ECG
ECG 4b. Precordial leads of the same patient is seen above.
The ECG is recorded at a paper speed of 50 mm/second, which has contributed to the wide appearance of the QRS complexes.
The above ECG has been donated by Dr. Peter Kukla to our website.
Click here for a more detailed ECG
ECG 5a. The ECG above belongs to an 85 years-old woman with mild aortic stenosis and a serum potassium level of 7 mmol/L.
There is right bundle branch block, The amplitude of the P wave in lead II is diminished.
Click here for a more detailed ECG
ECG 5b. The next day, her serum potassium level was decreased to 5.7 mmol/L and the above ECG was recorded.
Now the P wave amplitude in lead II is higher and the width of the QRS complex in anterior leads are lesser.
Click here for a more detailed ECG
ECG 6. Above is an ECG from a 75 years-old woman with hypertension, COPD, and chronic renal failure.
When the above ECG was recorded, her serum potassium level was measured as 8.6 mmol/L (hyperkalemia).
She was also under Digoxin therapy.
Nodal rhythm is seen. P waves are not visible.
QRS complexes are widened and the T waves in right precordial leads are relatively prominent.
This ECG was recorded at a standart calibration of 25 mm/second.
Hyperkalemia may result in tall, pointed T waves.
In the above ECG, many leads show QRS complexes and T waves with similar amplitudes.
Because of this, the ECG software counts QRS complexes and T waves as seperate QRS complexes,
which results in inadvertently doubling the heart rate as 62/minute.
The actual heart rate in this patient is 31/minute.
Click here for a more detailed ECG
ECG 7a. The ECG above belongs to an 84 years-old woman with chronic renal failure, hyperkalemia (6.9 mmol/L)
and coronary artery disease. This ECG is recorded at a standard calibration of 10 mm/mV.
Click here for a more detailed ECG
ECG 7b. This ECG belongs to the same woman.
It was recorded 30 seconds after the ECG 7a, but at a calibration of 20 mm/mV.
Now P waves are easily discernible. The rhythm is junctional (nodal) rhythm.
Junctional beats do not have preceding P waves.
Some atrial extrasystoles with P waves are also seen.
Click here for a more detailed ECG
ECG 8a. The ECG above belongs to an 65 years-old woman with lung cancer, acute renal failure and right heart failure
(probably due to acute pulmonary embolism).
Her serum potassium level was measured as 8.0 mmol/L while her serum creatinine level was 2.1 mg/dL.
Sharp, pointed T waves with narrow bases and relatively short QT interval should raise the suspicion of hyperkalemia.
Nodal rhythm with no preceding P waves and right bundle branch block are seen.
This ECG was recorded at a standard calibration of 10 mm/mV.
Sometimes pointed tall T waves may be sensed by the ECG software as another QRS complex (as in the above ECG),
resulting in false reporting of the heart rate. On the left upper corner of the above ECG, the heart rate is printed as 109/min.
However, the actual heart rate in this patient is 54/min.
Dr. Sinan Altan Kocaman has donated the above ECG to our website.
Click here for a more detailed ECG
ECG 8b. The above ECG belongs to the same woman. It is recorded after the ECG 8a but at a calibration of 20 mm/mV.
Dr. Sinan Altan Kocaman has donated the above ECG to our website.
Click here for a more detailed ECG
ECG 8c. The 6-channel rhythm tracing above belongs to the same woman. It is recorded shortly after the ECG 8b.
Irregular junctional rhythm (junctional arrhythmia / nodal arrhyhtmia ) is seen.
In leads II, III and aVF, some junctional beats have preceding retrograde P waves with short PR intervals, and some do not.
Calibration is 20m mm/mV.
Dr. Sinan Altan Kocaman has donated the above ECG to our website.
Click here for a more detailed ECG
ECG 9. The ECG above belongs to a 57 years-old man with chronic renal failure and coronary artery disease.
He had undergone coronary artery bypass graft surgery 6 years ago.
The bradycardia is due to his medication: Metoprolol 100mg/day (beta blocker).
When the above ECG was recorded, his serum potassium level was high (5.8 mmol/L).
Narrow-based and pointed T waves in chest leads are seen.
Click here for a more detailed ECG
ECG 10. The ECG above is from a 53 years-old man with chronic renal insufficiency and hypertension.
At the time the above ECG was recorded, her serum potassium level was measured as 6.2 mmol/L.
Peaked T waves with narrow bases are seen.
Click here for a more detailed ECG